Deer mouse fur color is controlled by the MC1R gene, with RD and RL alleles, and different combinations produce dark, medium, or light brown fur. In this lesson, students observe and measure alleles over time in a changing population.*
Why focus on alleles?
Traits often depend on a myriad of alleles. While the expression of these alleles (the genotype) is not always clear or visible in an organism’s phenotype, the alleles are a clear marker of change. In the Next Generation Science Standards, students are expected to be able to explain that the process of evolution depends on the “heritable genetic variation of individuals in a species” (HS-LS4-2). Students also need to apply mathematical processes to explain evolution (HS-LS4-3). Learning how to calculate and use relative allele frequency (RAF) can help students meet these performance expectations. RAF is a measure often used to describe the amount of genetic variation in a population and when RAF is calculated at different points across time, it can be used to explain how a population shifts, or evolves.
Step 1: Explore
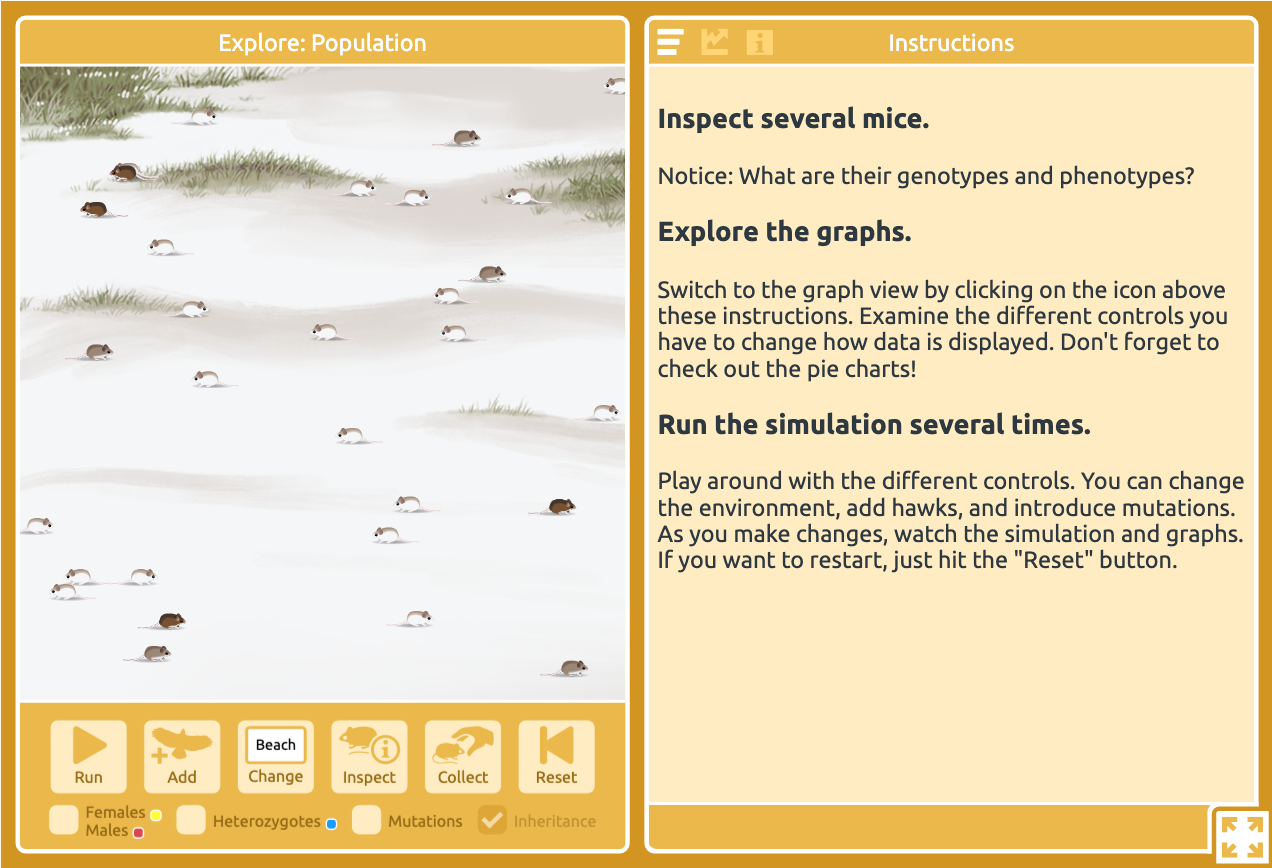
Launch the ConnectedBio Multi-Level Simulation: short.concord.org/lm9
Examine several mice using the “Inspect” button.
- What information is provided?
- Which allele combinations produce which fur colors?
Play around with the controls and run the simulation several times (click “Reset” to start over).
- How do the populations and corresponding graphs appear to change over time under different conditions?
Step 2: Calculate
Practice calculating the Relative Frequency of Alleles in sample populations over time using this worksheet: http://short.concord.org/lma. (Formulas and an example are provided, as well as pre-divided pie charts for graphing solutions.)
Step 3: Synthesize
Hold a class discussion, asking students:
- What might cause RAF to change over time?
- How does RAF represent evolution?
- How does measuring RAF differ from considering fur color?
- What are some of the advantages to the calculation?
Step 4: Predict and Investigate
Review the controllable variables in the simulation (e.g., adding or removing hawks, allowing mutations) and generate questions about how the RAF changes over time as a result of these different variables. Work with partners to develop a strategy to investigate these ideas. Present your findings, considering the following:
- What variable are you testing?
- How did you run your experiment?
- What data did you collect?
- How are you interpreting your data?
- Extension: What else might you need to test to verify your conclusion?
Note: You can try different initial populations using these links:
- 70% dark, 15% medium, 15% light: short.concord.org/lmb
- 15% dark, 70% medium, 15% light: short.concord.org/lmc
- 15% dark, 15% medium, 70% light (original settings): short.concord.org/lm9
Optional Extension
“Collect” the inspected mice and click the “Organism” tab. Put the mouse in the Explore pane, zoom into the nucleus, and examine the chromosomes.
- Where are the RD and RL alleles located?
- What other alleles code for fur color?
- What new questions do you have about mouse fur color?
The ConnectedBio curriculum
The ConnectedBio curriculum helps students create a network of connected biological concepts spanning multiple scales—from the population, organism, molecular, and heredity levels—using a series of online interactive lessons.
* Note: It is recommended that students complete “Adaptation is for Populations” prior to this lesson, though it is not required.