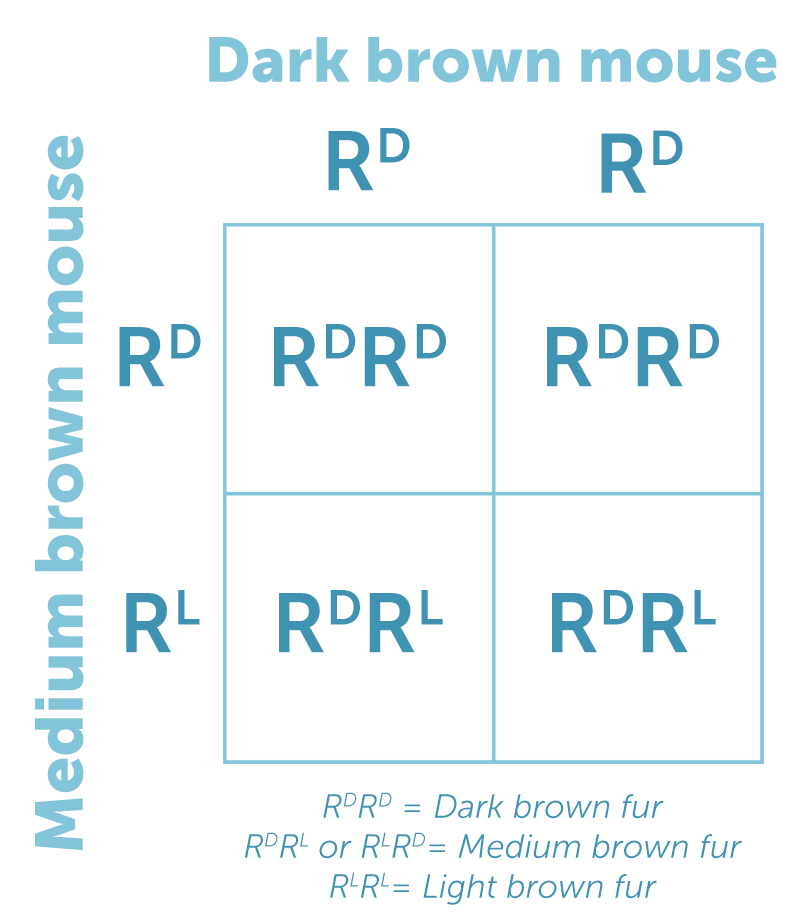
Most biology students have used a Punnett Square, diligently filling in each cell with combinations of genetic alleles. But when asked to explain the Punnett Square in Figure 1, which shows the probability of fur color in the offspring of a dark brown mouse and a medium brown mouse, students often say, "So, if the parents have four babies, two will always be dark brown." This is not always true.
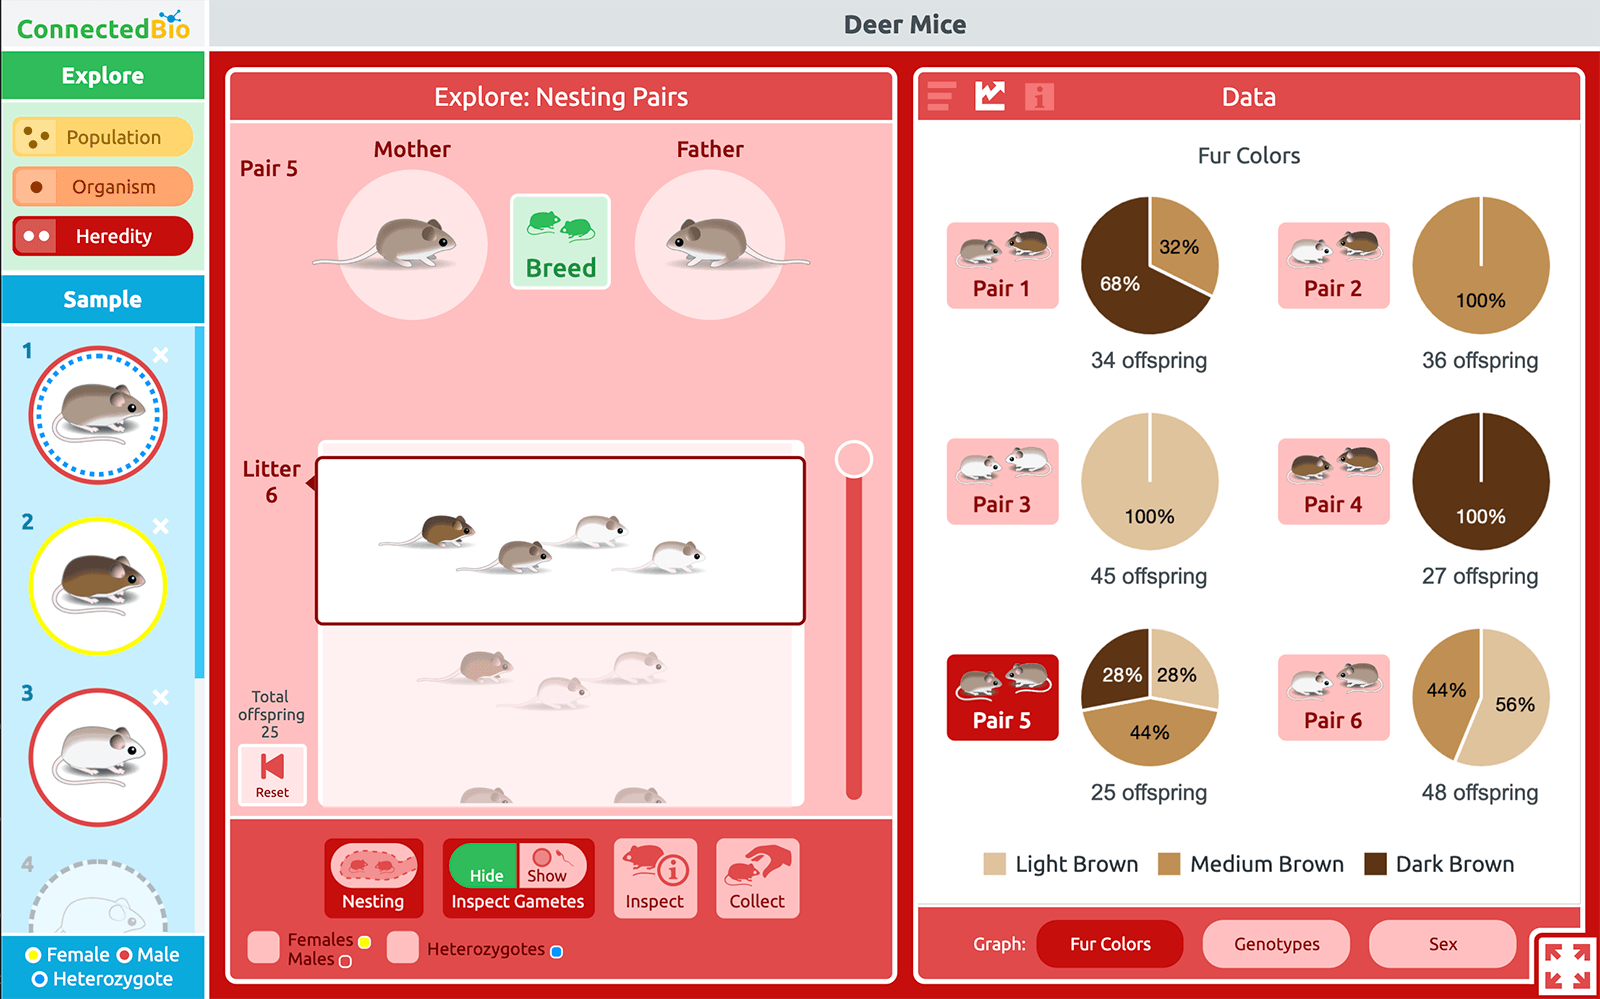
An innovative new breeding simulation helps reveal genetic ratios in offspring. With the heredity level of the ConnectedBio Multi-Level Simulation (MLS), students breed pairs of mice with different fur colors and observe the phenotypic ratios in the resulting offspring. The goal of this activity is to demystify the science behind Punnett Squares and encourage students to explore data and statistical representations in genetics and heredity. Students investigate the ratios of fur color phenotypes, genotypes, and sex among offspring of a variety of parent mice combinations. There are three possible phenotypes for fur color in deer mice: light brown fur (RL RL ), medium brown fur (RL RD or RD RL ), and dark brown fur (RD RD ). After each parent pair breeding, the resulting litter of offspring is shown, along with a pie chart, which updates to display the ratios in the total number of offspring for those parent mice. Students use this data to reason about the differences in offspring ratios and the probabilities of fur colors and genotypes between the various combinations of parent mice.
Explore phenotypic ratios in deer mouse offspring
Launch the ConnectedBio MLS: short.concord.org/lls
- Select a pair of mice to breed from one of the nests.
- Breed the parent mice by clicking Breed.
Notice that each time the mice breed, a new litter appears below the parent mice and the pie chart for that parent pair updates in the data pane on the right.
As your students explore this simulation, have them report their results and tally the class results where everyone can see. Students should notice that as they breed the pairs that produce more than one color, the pie chart initially shows large fluctuations in the ratios of offspring fur colors, but then gradually stabilizes as the number of offspring increases. In other words, random events can give rise to predictable ratios in offspring between parents!
Ask students to reflect on:
- Why do some of the pie charts change as you breed the mice?
- Why do the pie charts stabilize?
- Where are the numbers different from the ratios in a Punnett Square? Where are they the same?
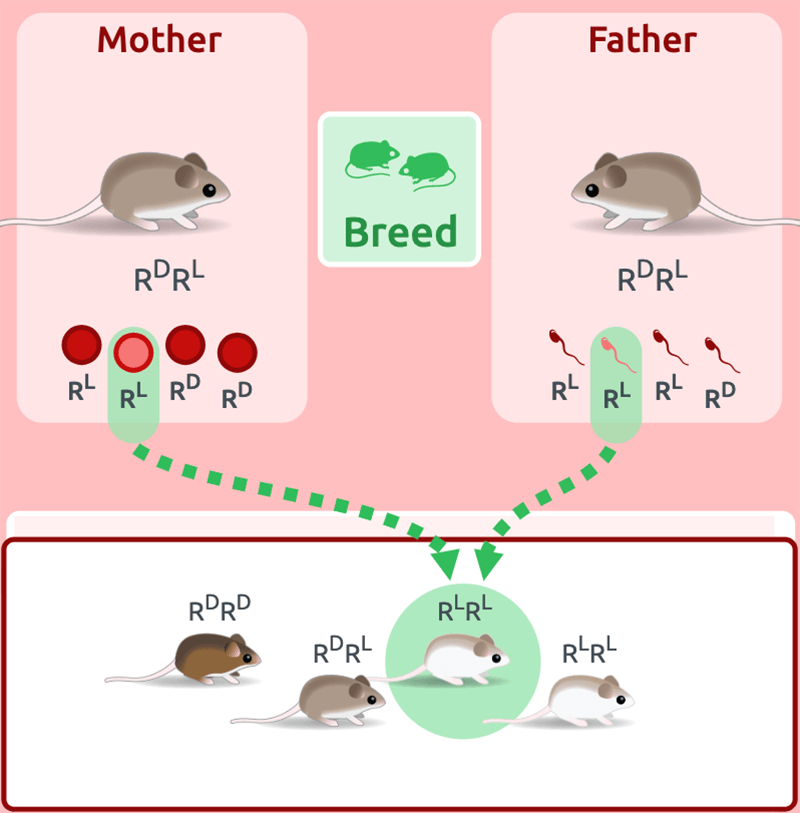
To dive deeper into the genetics of fur color, use the Show/Hide buttons to reveal the gametes responsible for each offspring and associated genotypes for each mouse. Hover over a gamete or mouse to trace the egg and sperm that give rise to an offspring. This visual display helps students see that each parent generates many gametes, but that each offspring only receives one gamete from each parent (Figure 2).
The ConnectedBio curriculum
The ConnectedBio curriculum helps students create a network of connected biological concepts spanning multiple scales—from the population, organism, molecular, and heredity levels—using a series of online interactive lessons.